An average compresses experience. That is its strength: many observations become a manageable summary. It is also the reason to look carefully at what was compressed. A number can describe the center of a collection while concealing whether events clustered near the beginning, the end, or neither. Reading an average responsibly starts by asking which distinctions disappeared during the calculation.
This article offers original scientific interpretation for men over 50 who want to understand treatment research before discussing care. Fictional examples explain the mathematics; none describes an actual participant or supplies a treatment target. The central question is how a diary summary relates to time, and what additional information would be needed to support a more specific claim.
The reported measurement
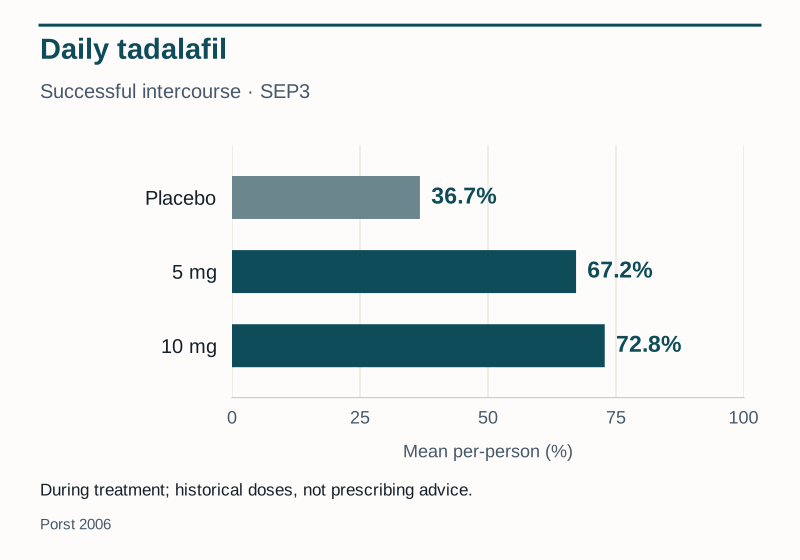
| Group | % |
|---|---|
| Placebo | 36.7% |
| 5 mg | 67.2% |
| 10 mg | 72.8% |
Download: SVG chart · PNG chart · CSV data
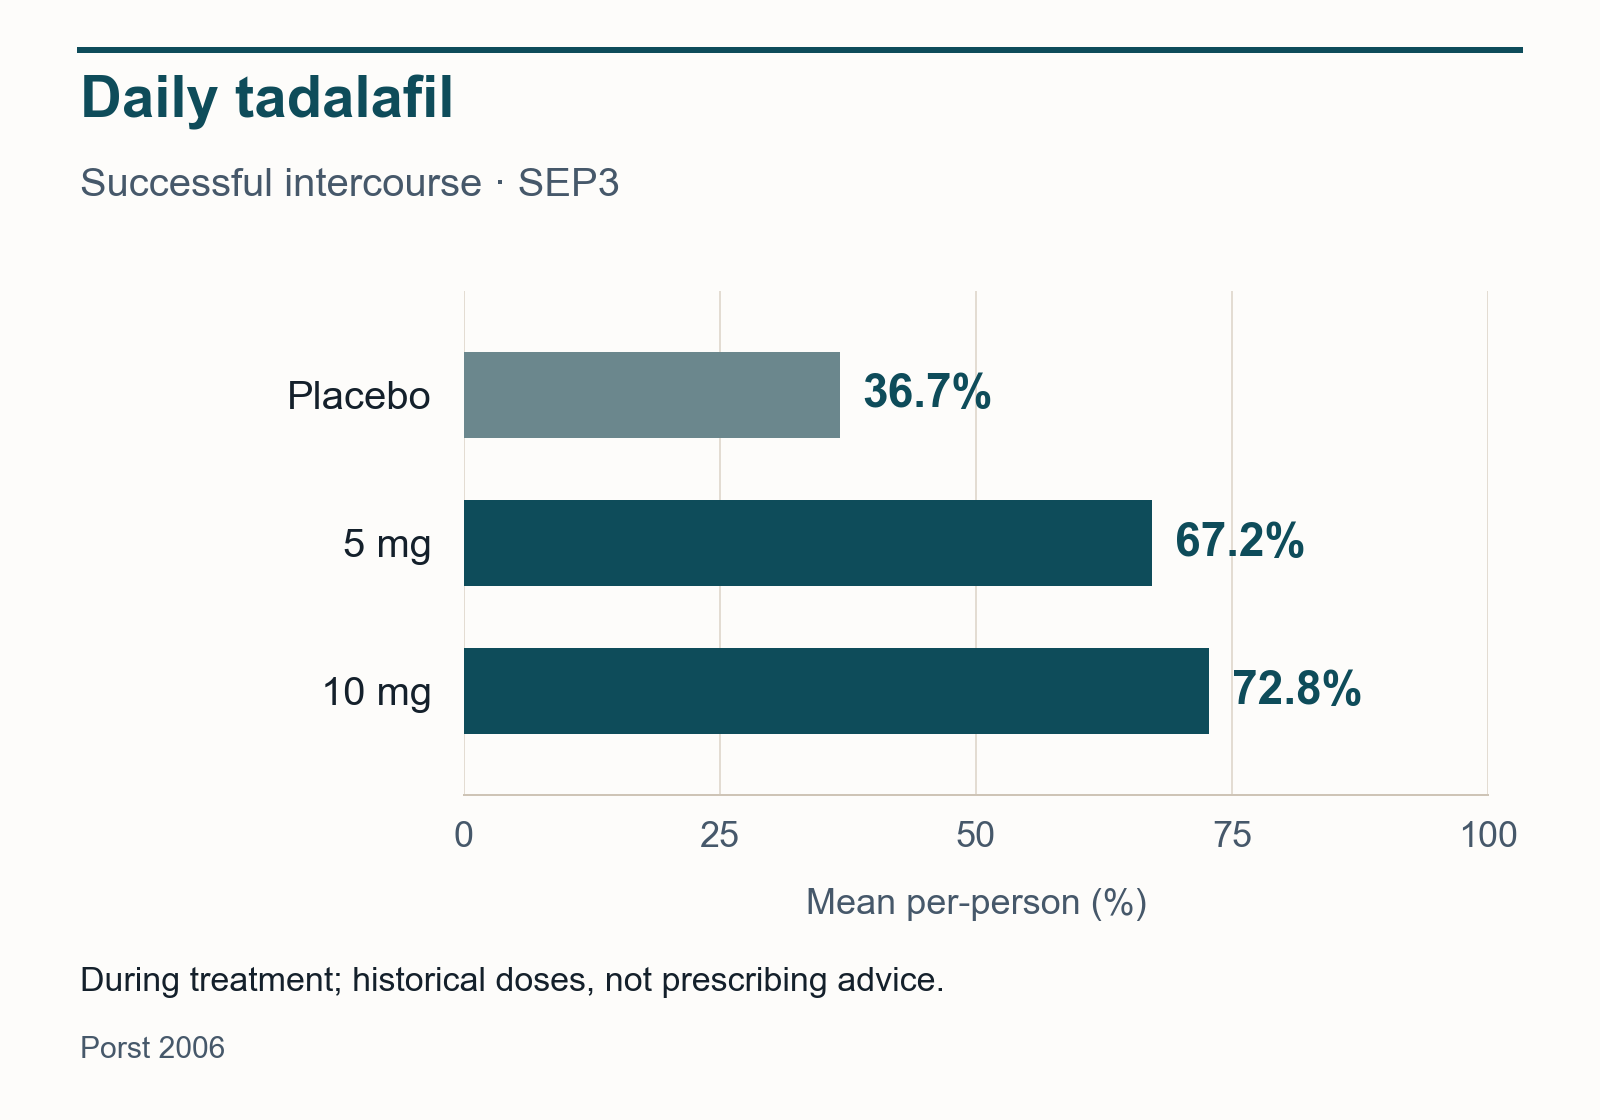
Identify what was averaged before reading the bars
Study design: randomized, double-blind; 268 men with ED; oral 5 or 10 mg daily versus placebo; 12–15 weeks. Co-primary outcomes: questionnaire function, penetration, intercourse completion. Chart: individual completion rates averaged across treatment.
There are two distinct operations in a participant-level mean. First, observations within each person are summarized. Then those person-level summaries are averaged across the group. The sequence matters because people can contribute different numbers of observations. If the events were combined before calculating a percentage, the answer could change even though the underlying records stayed exactly the same.
Our interpretation is that reading a chart requires naming its mathematical object, not merely its subject. A percentage of events, an average of percentages, and a percentage of people meeting a threshold all sound like success rates in conversation. They have different denominators and support different questions. The comparison guide for oral ED medicines provides general orientation; this analysis focuses on the additional work needed to understand a particular research measure. Identifying that measure is the first step toward judging whether a claim actually follows from it.
Sources: 1
The same mean can conceal opposite sequences
Consider two fictional logs, each containing five encounters. One records two successes followed by three failures. The other places the same successes at the end. Each has the same percentage, although the order is reversed. The table deliberately changes only the sequence. It is an illustration of information loss, not a model of how treatment usually unfolds.
A third possible sequence would place the successes between failures. Once the entries have been collapsed into a mean, it is impossible to choose among these histories from that mean alone. Describing an average as evidence of immediate response, gradual improvement or consistent availability therefore adds a claim about timing that needs more detailed observations.
Our interpretation is to distinguish a result from a trajectory. A result states a summary. A trajectory describes a path through time. Researchers investigating a path need to define the intervals, count relevant opportunities and examine how the pattern varies between people. They also need enough observations to avoid mistaking a chance cluster for a trend. No amount of confidence in a summary can restore the ordering that the calculation removed.
| Fictional log | Sequence from first to last | Success fraction |
|---|---|---|
| Early cluster | Success, success, failure, failure, failure | 2 / 5 |
| Late cluster | Failure, failure, failure, success, success | 2 / 5 |
| What changes | Order only | The fraction stays equal |
Sources: 1
Equal weight does not mean equal information
Suppose one fictional record contains one success in one attempt, while another contains eight successes in ten attempts. Their individual percentages are 100% and 80%; an equal-person mean is 90%. Combining the events would instead give nine successes in eleven attempts, about 81.8%. These invented numbers illustrate weighting only. They are not estimates of either medicine’s performance.
Giving each person equal weight can be appropriate when the intended question concerns the average person-level experience. Yet the precision of each person’s estimate can differ. A percentage based on one observation may shift dramatically with the next observation. A percentage based on many observations may be less sensitive to one added event, although repeated events can still share common influences.
Equal weighting therefore expresses a choice about the target of the summary; it does not make the underlying records equally detailed. A useful report would help readers understand both the average and the information supporting it. Our sildenafil observation-window analysis examines a different aggregation choice. The comparison is methodological: changing the unit of analysis changes the question. It does not establish a head-to-head treatment ranking.
The amount reached and the distance traveled
A treatment-period level and a change from baseline answer different questions. The level describes where a measure sits. The change describes how far it moved from its starting value. Without identifying which quantity is being reported, it is easy to mistake a large improvement for a high final level, or a high level for a large improvement.
For an unrelated fictional example, moving from 20% to 35% is a rise of 15 percentage points. Relative to the starting value, that is a 75% increase. Those statements describe the same movement with different denominators. They are not interchangeable labels, and neither means that an additional 75% of people experienced success. A change in a group measure does not itself count individual responders.
Our interpretation is to read the noun beside the number: level, change, percentage points, relative change or proportion of people. Each requires a different calculation. Starting values also matter when comparing changes, because two groups can move by the same amount and arrive at different levels. The arithmetic cannot identify which result matters more to a person without first defining the outcome and the question.
Sources: 1
An endpoint needs a definition of success
A study can measure an event, a person’s broader experience, or whether a score crosses a selected threshold. These are different kinds of evidence. An event question asks about something that happened. A questionnaire can combine responses across several aspects of experience. A threshold converts a continuous or ordered score into a category. Each operation leaves some information behind.
For example, in an original hypothetical scoring system, two people could land just above and just below a cutoff while having almost identical scores. Another pair could both remain below it despite very different degrees of improvement. A category can be useful for a specified purpose, but it should not erase the size or meaning of the underlying change.
Our interpretation is to ask what success means before asking how often it occurred. The research definition may be narrower than a reader’s goal, such as confidence, comfort or a satisfying shared experience. That mismatch does not invalidate the measure. It identifies another question to discuss. Our guide to talking with a partner about ED can help frame personal priorities without treating them as outcomes that a particular study necessarily measured.
Sources: 1
Three uncertainties that a central value leaves open
A mean can be known while the spread remains unclear. One fictional group could have tightly clustered person-level results; another could contain two very different clusters with the same mean. The average alone cannot distinguish those distributions. It therefore cannot tell a reader how common an experience near the average actually was.
Precision is a separate issue. A confidence interval describes uncertainty around an estimate under stated assumptions; it does not show the full range of individual experiences. An interval for a group average and a prediction about an individual answer different questions. Here, no confidence interval is reverse-engineered from rounded chart values, because doing so would require the underlying data and the appropriate analytical assumptions.
A further uncertainty concerns missing information. More detailed reporting might resolve one gap while leaving another untouched. The original framework below separates these questions so that a request for better evidence can be specific. Asking for more data is most useful when it identifies which uncertainty the additional data should address. A longer report is not automatically a more informative answer to every question.
| Uncertainty | What remains unknown | Evidence that could help |
|---|---|---|
| Sequence | When the events occurred | Records arranged by time |
| Distribution | How widely people’s results differed | Person-level spread or appropriate summaries |
| Missingness | What unavailable records might change | Missing-record descriptions and sensitivity analyses |
Sources: 1
Observation opportunities are part of the calendar
A treatment calendar and an encounter calendar need not advance together. In a hypothetical study, one person might have many opportunities early and few later; another might show the opposite pattern. A period-wide summary can then reflect both outcomes and the distribution of opportunities. Dividing the calendar into equal intervals would not automatically give every interval equal information.
The same problem appears when an observation period is longer for one record than another. More calendar time can allow more observations, but it does not guarantee them. Researchers need rules for defining the analysis period, handling incomplete records and deciding which comparisons are meaningful. Those rules are part of the meaning of an outcome, rather than administrative details that can be ignored once a percentage is available.
Our interpretation is that a sound timing claim should explain both the clock and the opportunities to observe the event. An absence of recorded success may mean different things when there were no attempts, unavailable entries or documented unsuccessful attempts. This article does not assign outcomes to those possibilities. Our appointment guide provides context for discussing what information would be useful during an individual review.
Sources: 1
A fair comparison still has a target population
Randomization helps compare assigned groups within a study. It does not randomly select every future person who might seek care. That distinction separates internal comparison from applicability: whether an effect is estimated fairly in the research setting, and whether that estimate is informative for another setting. Both questions matter, and neither can substitute for the other.
For a man over 50, age is one possible point of comparison, not a complete description of relevance. A group mean would not imply that every participant was that age or that every person of that age resembles the group. The underlying condition, prior treatment experience, accompanying illness and measurement setting can all define questions about applicability without establishing an answer in advance.
Our interpretation is to compare the reader’s question with the study’s question before comparing numbers across papers. Separate trials also have separate comparison groups and procedures. A larger bar in one does not isolate a drug difference from all the other differences between studies. A direct comparative question requires evidence designed to address it, or a justified analytical approach with transparent assumptions. Simply placing two published percentages next to each other does not provide that design.
A familiar ingredient is only one part of the match
A formulation claim introduces another layer of evidence. Our editorial interpretation is that connecting research to a different finished product requires checking what changed and why the original result should remain informative. An ingredient name alone does not answer questions about formulation, regimen or the exact outcome being promised. Nor does a different formulation automatically prove inferiority; it defines a question that needs evidence.
FDA states that compounded medicines lack FDA approval and are not reviewed by the agency for safety, effectiveness or quality before marketing. They can meet an individual medical need. This regulatory distinction should not be converted into an unsupported claim that every compounded preparation has the same performance or that none can be useful.
For documentary reading, our guide to questions before buying online helps organize the information to look for. The ZipHealth tadalafil review and PlushCare consultation review provide places to inspect stated terms. These links do not establish trial-equivalent formulations, outcomes or clinical quality. The scientific question remains whether the evidence matches the specific claim, while the documentary question is what the service actually states.
Keep historical doses separate from current prescribing
Reported harms included indigestion, headache, back, muscle and abdominal pain. Current Cialis labeling lists 2.5 and 5 mg for daily ED use; the 10-mg research arm is historical, not personal prescribing advice. Daily exposure keeps interaction review relevant between sexual encounters. Cardiovascular status, kidney/liver function, other medicines and substantial alcohol consumption matter.
Do not combine tadalafil with nitrates or riociguat, or self-combine ED medicines. Nitrates may be considered only for medically necessary treatment of a life-threatening situation, at least 48 hours after the last dose, under close medical supervision with blood-pressure monitoring. It is not a home countdown. An erection over four hours requires emergency care. Sudden vision/hearing loss requires stopping the medicine and prompt care. Chest pain, dizziness or nausea during sex requires stopping activity and immediate help; tell emergency clinicians about recent use.
Our interpretation is that a research regimen identifies what was tested, while current prescribing information supplies a different kind of authority for care. A diary average cannot establish individual eligibility or authorize a combination. It also cannot turn continued exposure into a promise of constant readiness. Reading effectiveness and safety together preserves the value of the research without treating a summary as a personal treatment plan.
Editorial assessment
Our assessment is that a useful reading keeps the mathematical operation attached to its clinical question. An average can organize many records while leaving the sequence, distribution and missing observations unresolved. Those are specific scientific questions, not reasons to dismiss a result. Before converting a chart into a personal expectation, identify what was counted, how people were weighted and which period the summary represents. Then separate the evidence for the measured outcome from claims about timing, persistence or another product. That discipline makes the research more informative for a conversation with a prescriber.
Evidence limits
Full paper retained; fresh access blocked (403). Protocols, supplements, individual data unreviewed. Lilly ICOS funding; company analysis/writing support. Fictional examples explain methods and do not reconstruct participant records. This article is editorial scientific interpretation and does not claim clinician review.
Questions about the evidence
Does an average describe the experience of a typical person?
It describes a mathematical center, which may or may not resemble a common individual experience. A group can contain a narrow cluster, a wide spread or distinct clusters with the same mean. To judge what typical means, readers need information about the distribution, not just its center. No individual response probability is calculated here. 1
Why does the time order matter if the total stays the same?
Order is necessary for claims about how an experience develops. The same total could come from early success, late success or scattered events. A summary remains useful for its intended question, but it cannot identify a path after the ordering has been removed. An onset claim needs observations capable of locating onset. 1
Is a daily schedule proof of continuous clinical benefit?
A schedule describes administration; a clinical outcome describes an experience. They are different measurements. Our interpretation is that a claim of continuous benefit would need evidence resolving the relevant periods and conditions, rather than relying on the word daily. Current prescribing safeguards still apply, and the chart is not a personal promise of availability. 1 3
Can a numerical difference between doses select a prescription?
A numerical ordering alone is not a complete comparative analysis. One needs the intended comparison, its uncertainty, adverse effects and the clinical context. A research arm also does not determine an individual prescription. Read the relevant current labeling with the prescriber, rather than turning an ordering of group summaries into a dosing rule. 1 3
What would help answer whether a benefit persists after treatment ends?
Observations under appropriate post-treatment conditions would be needed, together with information about who was followed and what else changed. Continued observation during ongoing treatment addresses a different question. This is a distinction between research designs, not a suggestion to stop medicine to test a theory. The claim and the observation conditions must match. 1 3
References
- Study. Porst 2006.Checked 2026-10-24. Full paper.
- Study. Goldstein 1998.Checked 2026-10-24. Full paper.
- Current prescribing information. Cialis (tadalafil) prescribing information.Checked 2026-10-24.
- Current prescribing information. VIAGRA (sildenafil citrate) US prescribing information.Checked 2026-10-24.
- FDA public information. Understanding the risks of compounded drugs.Checked 2026-10-24.